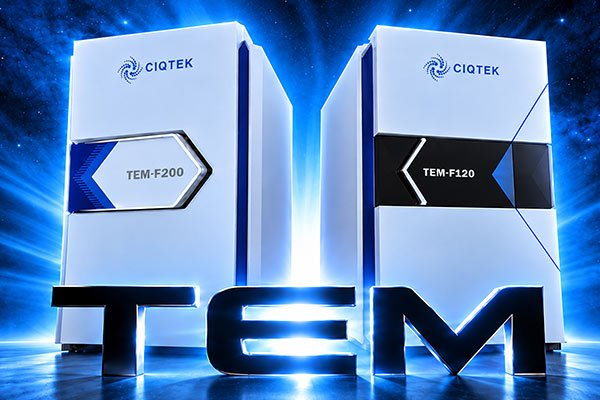
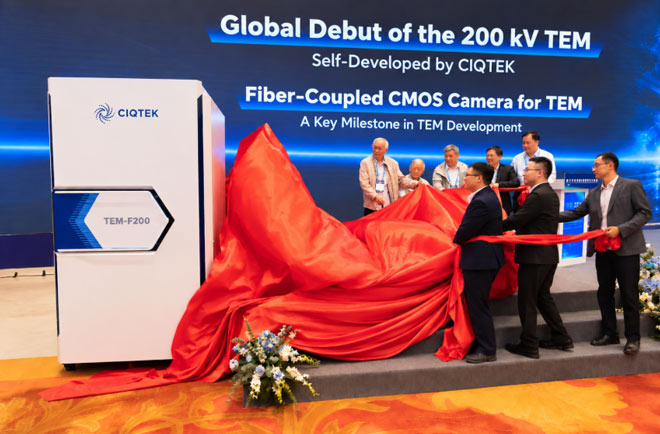
CIQTEK has officially launched its 200 kV field emission transmission electron microscope, TEM-F200, delivering 0.10 nm information resolution and featuring several key subsystems developed in-house. Unveiled on October 18 at the 2026 National Electron Microscopy Annual Conference in China, the TEM-F200 is designed for demanding work in materials science, semiconductor research, and nanoscale characterization. The launch also marks another step toward a more complete domestic TEM platform, from key hardware to imaging and analysis workflows. Built Around Resolution, Stability, and Practical Use For TEM users, resolution is only part of the story. Stability, ease of operation, detector performance, automation, and service all affect what the microscope can actually deliver day-to-day. The TEM-F200 combines a 200 kV field emission electron source with a self-developed high-voltage power supply and optical system. TEM-F200 Key Specifications 200 kV Field Emission Transmission Electron Microscope Acceleration Voltage 20 to 200 kV Information Resolution 0.10 nm Point Resolution 0.25 nm STEM Resolution 0.16 nm STEM Detector Modes HAADF, ADF, ABF Magnification 20× to 1,200,000× Super-EDS Optional dual 100 mm² windowless SDD detectors with symmetrical geometry, energy resolution ≤127 eV Optional Configurations EELS, 4D-STEM, 3D-ED, in situ sample holder A thermostatic water-cooled objective lens and four-axis sample stage help support stable imaging, while automated aperture control, position memory, and one-click adjustment are designed to reduce repetitive manual work. The main imaging camera is CIQTEK’s self-developed 16-megapixel fiber-coupled CMOS camera, built specifically for TEM use. The camera combines a 9 μm CMOS sensor, 4K × 4K imaging, and up to 24 fps at full resolution. Less Time at the Controls, More Time on the Sample The TEM-F200 also puts a strong focus on workflow. Fluorescent-screen images can be transferred directly to the PC display, while high-voltage control, electron-gun auto-start, vacuum operation, sample-position auto navigation, and STEM detector movement can all be integrated into the system workflow. For laboratories that need more flexibility, the platform can also be expanded with EDS, EELS, 4D-STEM, 3D electron diffraction, side cameras, cryogenic components, and in situ holders. From FinFET Devices to Advanced Alloys The new system has already been demonstrated on a range of demanding samples. For semiconductor FinFET devices, local nanoscale features and fine lattice structures were clearly resolved, with FFT analysis showing a spacing down to 1.045 Å. Semiconductor FinFET Cross-sectional imaging of semiconductor memory chips clearly revealed multilayer thin-film and dielectric structures. For 7075 aerospace aluminum alloy, TEM-BF and STEM-HAADF imaging resolved nanoscale precipitates, discontinuous grain-boundary phases, and precipitate-free zones. The system was also used to e...
View MoreCIQTEK officially unveiled its self-developed TEM-F200 200 kV Field Emission Transmission Electron Microscope at the 2026 National Annual Conference on Electron Microscopy in Nanjing, China. The TEM-F200 was the headline launch among five new electron microscopy products introduced during the event. The new lineup also includes the TEM-F120 120 kV Field Emission TEM, SEM5000Ultra Ultra-High-Resolution Field Emission SEM, a purpose-built fiber-coupled CMOS camera for TEM, and CIQTEK SEM Agent. Together, the launches expand CIQTEK's electron microscopy portfolio from complete microscope systems to imaging hardware and intelligent software. A New 200 kV TEM Developed In-House On October 18, CIQTEK Vice President Dr. Cao Feng introduced the TEM-F200 during a conference presentation focused on the development of CIQTEK's 200 kV transmission electron microscopy technology. The system reaches an information resolution of 0.10 nm. Key components, including the high-voltage power supply, electron gun, constant-power water-cooled objective lens, fully automated apertures, and fiber-coupled CMOS camera, were developed in-house. The TEM-F200 is now ready for volume production and delivery. The launch marks an important step in CIQTEK's expansion into higher-end transmission electron microscopy and strengthens its ability to develop complete electron microscopy systems around core technologies. Five New Products Across TEM, SEM, Imaging and AI Alongside the TEM-F200, CIQTEK introduced four additional products covering different parts of the electron microscopy workflow: TEM-F120, a 120 kV Field Emission Transmission Electron Microscope SEM5000Ultra, an Ultra-High-Resolution Field Emission Scanning Electron Microscope A purpose-built fiber-coupled CMOS camera for TEM CIQTEK SEM Agent, an intelligent software platform for electron microscopy These launches extend beyond individual instruments. They cover complete TEM and SEM systems, core imaging components, and AI-powered software, showing a broader approach to electron microscopy development. From New Instruments to Smarter Microscopy Workflows During the 2026 National Annual Conference on Electron Microscopy, CIQTEK also hosted a series of product sessions covering its TEM portfolio, the new SEM5000Ultra and wider SEM lineup, as well as its AI electron microscopy roadmap and SEM Agent platform. The focus was not simply on adding more instruments. As microscopy workflows become more complex, users increasingly need a combination of high-resolution imaging, stable hardware, automation, and easier operation. By developing complete microscopes, core components, and intelligent software together, CIQTEK is building a more connected electron microscopy platform for materials science, semiconductor research, life science, and other advanced applications. Expanding CIQTEK's Electron Microscopy Platform CIQTEK also worked with seven industry partners during the conference to showcase technologies and ap...
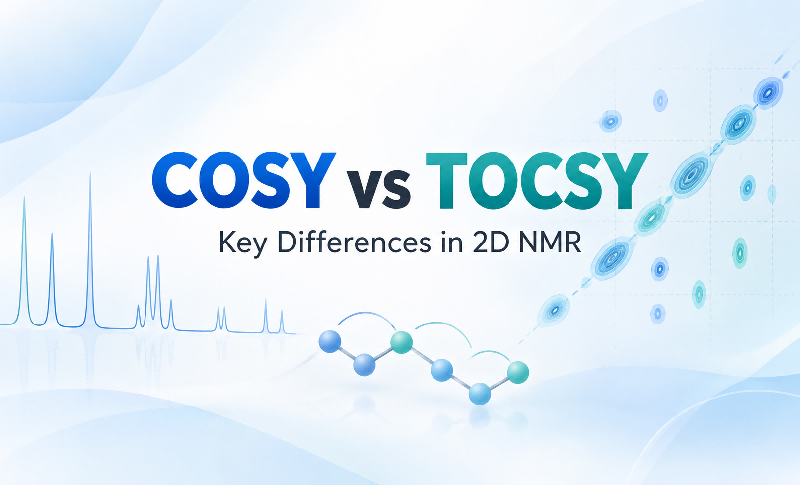
View MoreFor structural analysis of complex organic molecules and natural products, 2D homonuclear scalar-correlation NMR experiments are among the most useful tools for resolving ambiguities caused by overlapping signals in 1D spectra. Among the most widely used 1H-1H correlation experiments, COSY and TOCSY answer two different but complementary questions. COSY is mainly used to trace local proton-to-proton connectivity through observable J couplings, while TOCSY extends magnetization transfer through a continuous coupling network and helps identify all observable members of the same spin system. In practical terms, COSY helps answer "Which protons are coupled to each other?", while TOCSY helps answer "Which protons belong to the same spin system?" This article walks through the two experiments from pulse-sequence principles to practical spectrum interpretation, explaining their key differences and how they can be used together in 2D NMR spectroscopy. 1. Core Functions of COSY and TOCSY COSY, or Correlation Spectroscopy, and TOCSY, or Total Correlation Spectroscopy, both use scalar coupling, or J coupling, to provide proton correlation information through chemical bonds. However, the type of structural information they are designed to reveal is different. Consider a continuously coupled proton chain: H1 → H2 → H3 → H4 COSY: Local Coupling Connectivity COSY primarily detects directly observable scalar couplings between pairs of protons. The most common correlations arise from 2JHH and 3JHH couplings, for example: H1 ↔ H2H2 ↔ H3H3 ↔ H4 These pairwise correlations allow researchers to build the local proton connectivity step by step. In other words, a COSY spectrum is particularly useful when the goal is to reconstruct the sequential relationship between neighboring or otherwise detectably coupled protons. Note: COSY correlations are not restricted to two-bond and three-bond couplings. In allylic systems, aromatic systems, or rigid W-type geometries, a sufficiently strong 4J coupling, typically greater than about 1.5 Hz, may also generate a COSY cross peak. Therefore, the presence of a cross peak alone should not be taken as proof that two nuclei are directly adjacent in the molecular structure. TOCSY: Assignment of an Entire Spin System TOCSY takes a different approach. Through magnetization transfer across a J-coupled network, protons within the same continuous spin system can become correlated even when two particular protons do not show a strong direct coupling to each other. Its main purpose is therefore not to determine the direct connectivity of every proton pair. Instead, TOCSY is used to identify and group multiple protons that belong to the same spin system. For example, if H1, H2, H3, and H4 form a continuous coupling network, magnetization can propagate through the sequence: H1 → H2 → H3 → H4 As a result, correlations between more distant members of the system may appear in the TOCSY spectrum. Note: A...
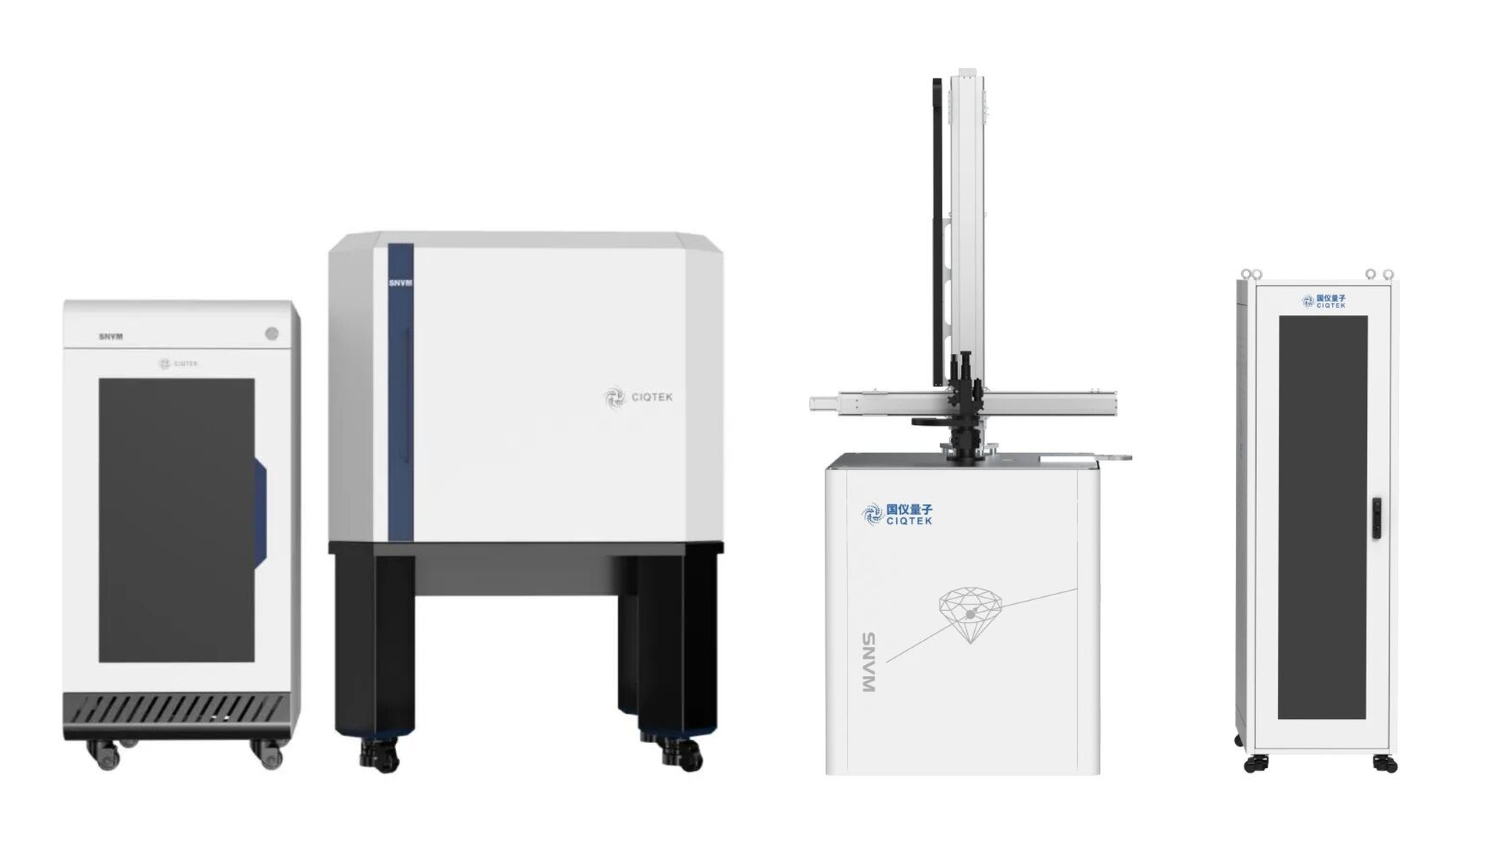
View MoreIn short Three research teams used CIQTEK ODMR instruments, including the scanning NV probe microscope (SNVM) and the diamond single-spin spectrometer, to move three different areas of advanced materials research forward. A team at the Institute of Physics, Chinese Academy of Sciences, imaged spin waves in real space near magnetic defects and antiferromagnetically coupled stripe domains in YIG and LSMO films. They captured wavelength-selective scattering and, for the first time, a zig-zag wavefront distortion as spin waves crossed stripe domains. A team at the University of Science and Technology of China stripped selenium out of 2D CuCrSe₂ by vacuum annealing. The resulting Se vacancies produced room-temperature ferromagnetism while the layered crystal structure stayed intact. A team at the Institute of Semiconductors, Chinese Academy of Sciences, mapped how a transverse magnetic field mixes NV center spin states, weakens optical readout, and shifts the balance between the NV⁻ and NV⁰ charge states, all of which matter for keeping NV-based sensors stable in real-world magnetic environments. Why this matters Optically detected magnetic resonance (ODMR) sits at the center of solid-state spin science. It is how researchers image microscopic magnetic fields, how they unpack spin dynamics, and how they turn a single atomic-scale defect in diamond into a working sensor. The three studies below all leaned on CIQTEK's ODMR product line, which includes the scanning NV probe microscope (SNVM) and the diamond single-spin spectrometer, to push into territory that older tools could not reach: spin wave imaging, room-temperature ferromagnetism in 2D materials, and the spin mixing behavior of NV centers themselves. Here is what each team found, and why it matters for anyone building magnonic devices, spintronic materials, or diamond-based sensors. Study 1: Scanning NV imaging reveals how spin waves actually propagate Where it was published: SCIENCE CHINA Physics, Mechanics & Astronomy Paper title: Visualizing modified spin-wave wavefronts near magnetic defects and domains using nitrogen-vacancy centers Research group: The Li Yangmu group at the Institute of Physics, Chinese Academy of Sciences The team used scanning NV imaging to perform real-space imaging and phase analysis of spin wave propagation and wavefronts near nanoscale magnetic defects and antiferromagnetically coupled stripe domains in magnetic thin films (YIG and LSMO). The work revealed wavelength-selective scattering and waveform modulation, giving device designers a new set of tools for building and tuning spin wave devices. First, some background: why spin waves are hard to see Spin waves, also called magnons, are collective excitations of a magnetically ordered system. They carry information without the Joule heating losses that come with conventional charge-based devices, which makes them an attractive carrier for low-power, w...
View MoreCIQTEK Lists on the Shanghai STAR Market CIQTEK held its listing ceremony at the Shanghai Stock Exchange on August 11, 2026. The listing marks a new stage for the company as it continues to develop high-end scientific instruments. The company trades under stock code 688828 and develops, manufactures, and sells products including electron microscopes, electron paramagnetic resonance spectrometers, and nuclear magnetic resonance spectrometers. Listing Information CIQTEK issued 40.0100 million shares at RMB 21.22 per share. The gross proceeds from the new share offering were RMB 849.0122 million. Following the offering, the company had 400.0100 million shares outstanding. In 2025, CIQTEK reported revenue of RMB 666.191845 million. The company is based in Hefei, Anhui Province. From Research to Real-World Use CIQTEK focuses on turning research capabilities into instruments that can be used in laboratories and industrial settings. At the ceremony, Dr. He Yu, Chairman of CIQTEK, said the listing is an important milestone and a stage in the company’s journey from the laboratory to real-world use. Dr. He thanked customers, partners, investors, and the teams that supported the offering and listing process. A Focus on Useful, Reliable Instruments CIQTEK develops high-end scientific instruments across several product areas. The company continues to invest in research and development and to expand its product portfolio around customer needs. Dr. He said that customer feedback, technical problem-solving, and reliable delivery are central to the company’s long-term improvement. CIQTEK will continue to advance projects funded by the offering and strengthen transparent, standardized governance. Looking Ahead Dr. He noted that better measurement tools support scientific discovery and that high-quality data remains essential as artificial intelligence changes the way research is done. CIQTEK will continue to build instruments for researchers and industrial users around the world. “We will stay focused, keep improving over the long term, and move forward steadily,” Dr. He said in closing. Reprint Note The opening and “Listing Information” sections are reprinted from a Shanghai Stock Exchange public release. The remaining sections are adapted from an original address by Dr. He Yu, Chairman of CIQTEK, delivered at the listing ceremony.
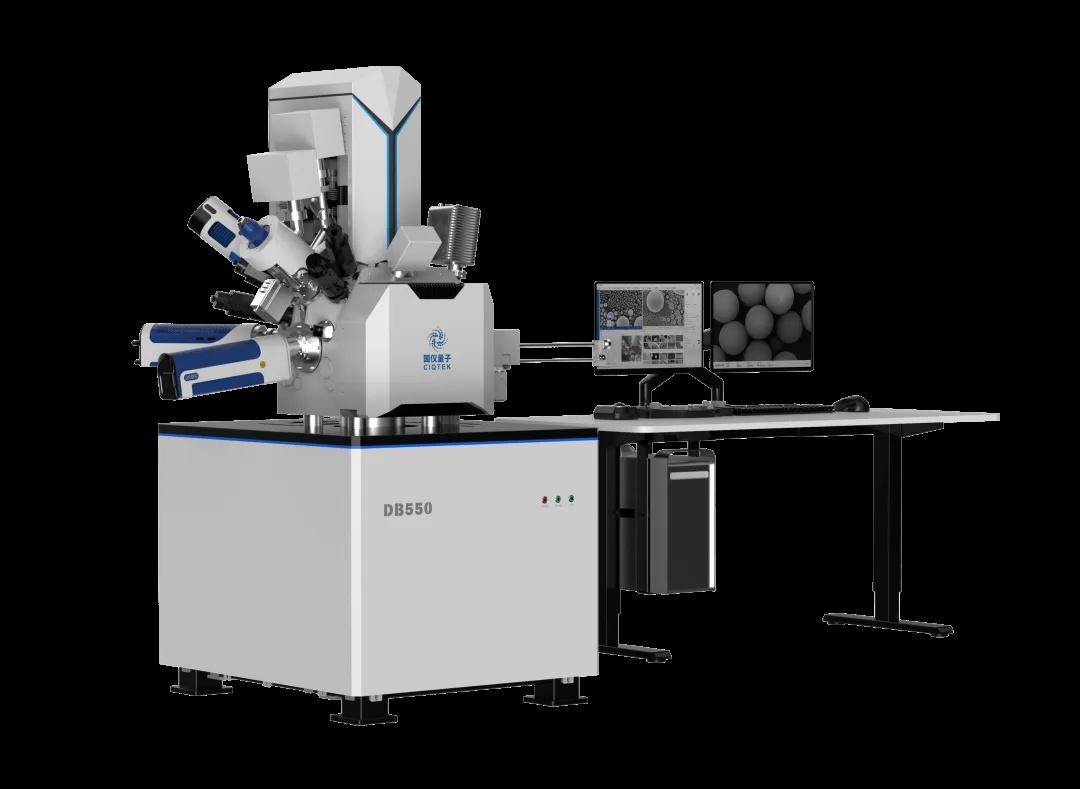
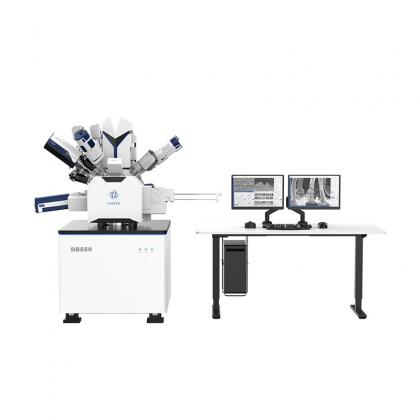
View MoreThe CIQTEK DB550 dual-beam FIB-SEM brings together high-resolution electron imaging and precision ion beam processing on a single platform. CIQTEK has validated its DB550 Focused Ion Beam Scanning Electron Microscope (FIB-SEM) on real 5nm process node chip samples, demonstrating production-ready TEM sample preparation with intact fin structures, zero amorphization, and clearly resolved film layers. The results confirm that the DB550 meets the exacting demands of advanced semiconductor failure analysis labs working at the cutting edge of process technology. In advanced chip research and manufacturing, two tools matter above all others. The Transmission Electron Microscope (TEM) lets you see structures at the atomic scale. But before you can look, you need a sample thin enough for electrons to pass through. That is where the dual-beam FIB-SEM comes in. It is the precision workshop that prepares those ultra-thin specimens. Meet the DB550: One Platform for Imaging and Nanoscale Processing The CIQTEK DB550 FIB-SEM integrates two powerful capabilities onto a single platform. On one side, a scanning electron microscope (SEM) delivers high-resolution surface imaging. On the other, a focused ion beam (FIB) performs nanoscale material removal with surgical precision. Together, they bridge the gap between observation and fabrication at dimensions measured in billionths of a meter. At the heart of the DB550 sits a low-voltage, high-resolution electron column paired with CIQTEK's proprietary "Chengying" ion column, developed entirely in-house. The Chengying column is the engine behind the system's nanoscale cutting and etching capabilities. CIQTEK controls the full design and manufacturing pipeline for this critical component. The 5nm Challenge: Why Sample Preparation Gets Harder at Every Node At 5nm and below, chip architectures rely on fin-type field-effect transistors (FinFETs) with fin widths and pitches measured in just a few nanometers. The DB550 is designed to handle the full sample preparation workflow for these demanding process nodes. It starts with high-current rough cutting to quickly remove bulk material and reach the target region. Then it transitions to low-voltage fine polishing to thin the sample to TEM-ready dimensions without damaging the delicate structures underneath. TEM Validation: The Proof Is in the Image CIQTEK prepared a 5nm process node chip sample on the DB550 and transferred it to a TEM for characterization. The results speak for themselves. TEM characterization of a 5nm chip sample prepared on the DB550 shows intact fin structures with clear, well-defined film layers and no amorphization damage. The TEM images revealed that the fin structures remained completely intact after FIB preparation. There was no detectable amorphization in the silicon crystal lattice. The individual film layers appeared clear and sharply defined in the TEM cross-section. These results validate the dual-beam sample preparation performance of the DB550 on...
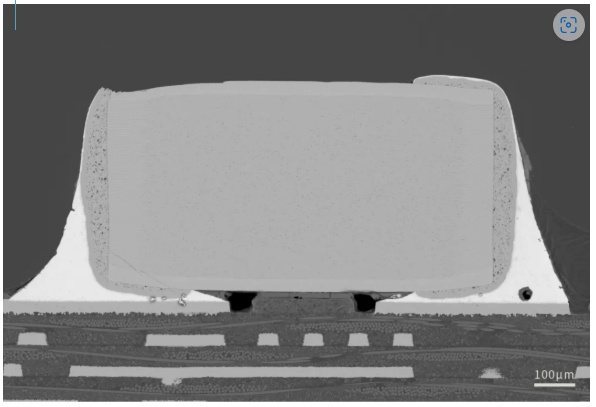
View MoreA Winning Team: SEM + FIB, the "Golden Combination" CIQTEK brings SEM and FIB together as a powerful team, providing critical support for PCB process optimization, reliability verification, and root cause determination of failures. SEM High-Resolution Imaging: The "Microscope" for Surface Details The SEM uses a high-resolution electron beam to capture crisp images of PCB surface morphology. It reveals solder pad plating, intermetallic compounds, micro-cracks, tin whiskers, and foreign particle contamination with exceptional clarity. Coupled with energy-dispersive X-ray spectroscopy (EDS), the SEM also performs elemental analysis on microscopic regions. This combination lets engineers identify the chemical signature of defects, making it straightforward to spot issues like short circuits, open circuits, corrosion, and plating anomalies. FIB Nanoscale Cutting: The "Scalpel" for Internal Structures While the SEM excels at surface imaging, the FIB takes over when you need to see what is happening inside the board. Using a nanometer-precision ion beam, the FIB performs targeted cross-sectioning at the exact defect location. It prepares ultra-thin slices through multi-layer boards, blind vias, and buried vias, exposing internal structures that mechanical sectioning simply cannot reach. Think of the FIB as a microscopic surgical tool. It removes material with nanometer accuracy, leaving a clean cross-section ready for imaging and analysis. CIQTEK Semiconductor Showcase: See It in Action The Beauty of the Microscopic World, Revealed in Every Detail. Here are real examples of CIQTEK electron microscopes in PCB cross-section observation: Solder Joint Interface Panorama Low magnification observation of capacitor overall morphology, viewing the real microscopic structure of the capacitor solder joint interface from the inside IMC Layer Evaluation Evaluating interlayer bonding, measuring IMC thickness and uniformity, detecting voids, cracks, and interface defects Multi-Layer Board Inner Structure Clear observation of IMC layer morphology, thickness, continuity, and density at the solder pad and solder interface Process Reliability Evaluation Evaluating trace pattern, thickness, etching quality and copper-to-substrate bonding, detecting line shift, etch defects, delamination, voids, and analyzing plating layer quality for PCB process control and reliability assessment Built for Labs That Demand Reliability CIQTEK develops its electron microscopy platforms from the ground up, covering core algorithms through hardware design. This vertical integration ensures consistent performance and long-term supply stability, which matters for labs running continuous production or multi-year research programs. The company backs its instruments with responsive technical support and regular software updates, helping users keep their systems running efficiently over time. Get in Touch If you are evaluating SEM or FIB systems for ...
View MoreTemperature is not just an environmental setting in electron paramagnetic resonance (EPR) spectroscopy. It is a core experimental parameter, right up there with microwave power and magnetic field range. Choose the right temperature, and you unlock sharper signals, stronger sensitivity, and structural details that room-temperature measurements simply cannot reveal. Choose wrong, and your signal may disappear entirely. This guide walks through the physics of variable-temperature EPR and helps you pick the right setup for your samples. Why Temperature Matters So Much in EPR Every EPR experiment involves three questions. How does temperature reshape the microscopic spin environment? How does it affect spectral interpretation? And which systems absolutely require variable-temperature measurements? Let us break it down. Cooling: The Simplest Way to Boost Sensitivity The EPR signal comes from a simple fact. Unpaired electrons occupy two spin energy levels, and the difference in population between those levels is what we detect. In an external magnetic field B0, electron spins undergo Zeeman splitting, creating two levels with ms = +1/2 and ms = -1/2. The energy gap between them is: The Boltzmann distribution governs how electrons populate these levels. The population ratio depends on temperature in a very direct way: Here is what this means in practice. The EPR signal intensity is proportional to the population difference between the two levels. That difference scales as 1/T. In other words, lower the temperature, and your signal gets stronger. Period. Temperature is an independent, fully controllable variable, so cooling your sample is the most fundamental and direct way to boost absolute sensitivity in EPR spectroscopy. EPR spectra of a weak coal sample measured at different temperatures. Lower temperatures deliver dramatically stronger signals. (Measured on CIQTEK EPR system.) Cooling Slows Relaxation, Revealing Hidden Signals Temperature does not just affect signal strength. It also controls spin relaxation, which determines whether you can detect a signal at all. Relaxation in magnetic resonance falls into two categories. Spin-lattice relaxation (T1). This is the process where excited spins exchange energy with the surrounding crystal lattice. It is highly temperature-sensitive. At room temperature, lattice vibrations are vigorous. Excited spins dissipate their energy quickly, so T1 is short. Cool the system down, and you effectively "freeze" those lattice vibrations. T1 lengthens dramatically. Spin-spin relaxation (T2). This arises mainly from magnetic dipolar interactions between neighboring spins. It is less directly affected by temperature. Spin-lattice relaxation rate as a function of temperature. The strong temperature dependence shows why cooling is essential for short-relaxation systems. (Ref: Phys. Chem. Chem. Phys., 2020, 22, 15751-15758) T2 controls the spectral linewidth. The homogeneous linewidth is inversely proportional...
View More
No. 1969, Kongquetai Road, High-tech Zone, Hefei, Anhui, China
+8615156059133
+8613083191369
info@ciqtek.com
Sitemap | XML | Blog | Privacy Policy | IPv6 network supported